Docker an open-source project that automates the deployment of software applications inside containers.
Configure Docker
To monitor a Docker engine, the first step is to specify the metrics-address. The best way to do this is via the daemon.json, which is located at one of the following locations by default. If the file does not exist, create it.
- Linux: /etc/docker/daemon.json
- Windows Server: C:\ProgramData\docker\config\daemon.json
- Docker Desktop for Mac / Docker Desktop for Windows: Click the Docker icon in the toolbar, select Preferences, then select “Docker Engine”.
If the file is currently empty, paste the following:
{
  "metrics-addr" : "0.0.0.0:9323",
  "experimental" : true
}
This will publish the metrics endpoint, in the port 9323 of the host.
After Docker restars, use web browser pointing to http://192.168.2.13:9323 (assuming the IP of the Docker engine’s machine is 192.168.2.13). A sample result:
# HELP builder_builds_failed_total Number of failed image builds
# TYPE builder_builds_failed_total counter
builder_builds_failed_total{reason="build_canceled"} 0
builder_builds_failed_total{reason="build_target_not_reachable_error"} 0
builder_builds_failed_total{reason="command_not_supported_error"} 0
builder_builds_failed_total{reason="dockerfile_empty_error"} 0
builder_builds_failed_total{reason="dockerfile_syntax_error"} 0
builder_builds_failed_total{reason="error_processing_commands_error"} 0
builder_builds_failed_total{reason="missing_onbuild_arguments_error"} 0
builder_builds_failed_total{reason="unknown_instruction_error"} 0
# HELP builder_builds_triggered_total Number of triggered image builds
# TYPE builder_builds_triggered_total counter
builder_builds_triggered_total 0
# HELP engine_daemon_container_actions_seconds The number of seconds it takes to process each container action
# TYPE engine_daemon_container_actions_seconds histogram
engine_daemon_container_actions_seconds_bucket{action="changes",le="0.005"} 1
engine_daemon_container_actions_seconds_bucket{action="changes",le="0.01"} 1
engine_daemon_container_actions_seconds_bucket{action="changes",le="0.025"} 1
engine_daemon_container_actions_seconds_bucket{action="changes",le="0.05"} 1
engine_daemon_container_actions_seconds_bucket{action="changes",le="0.1"} 1
engine_daemon_container_actions_seconds_bucket{action="changes",le="0.25"} 1
engine_daemon_container_actions_seconds_bucket{action="changes",le="0.5"} 1
engine_daemon_container_actions_seconds_bucket{action="changes",le="1"} 1
engine_daemon_container_actions_seconds_bucket{action="changes",le="2.5"} 1
Configure SysUpTime
-
Add a web site monitor:
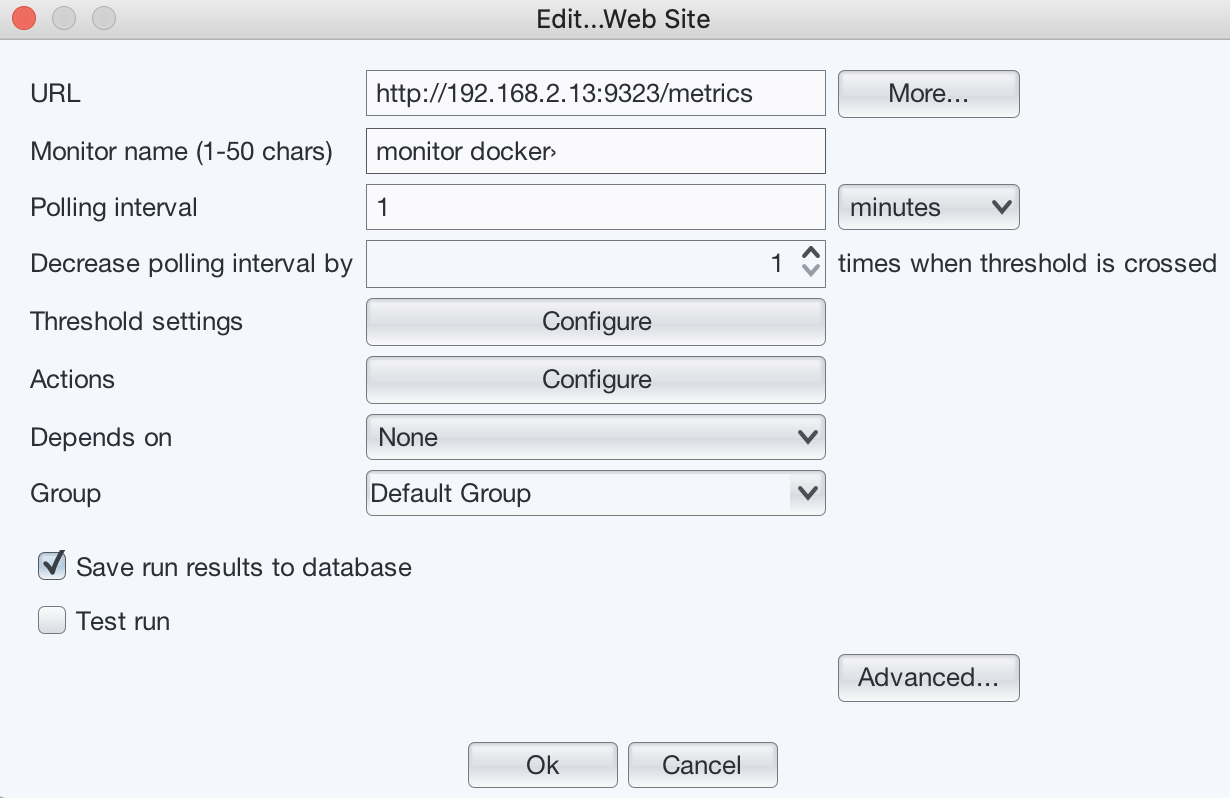
In the URL field, enter
http://192.168.2.13:9323/metrics (Replace 192.168.2.13 with real docker engine's IP address) -
Press “Configure” button next to the “Threshold settings”.
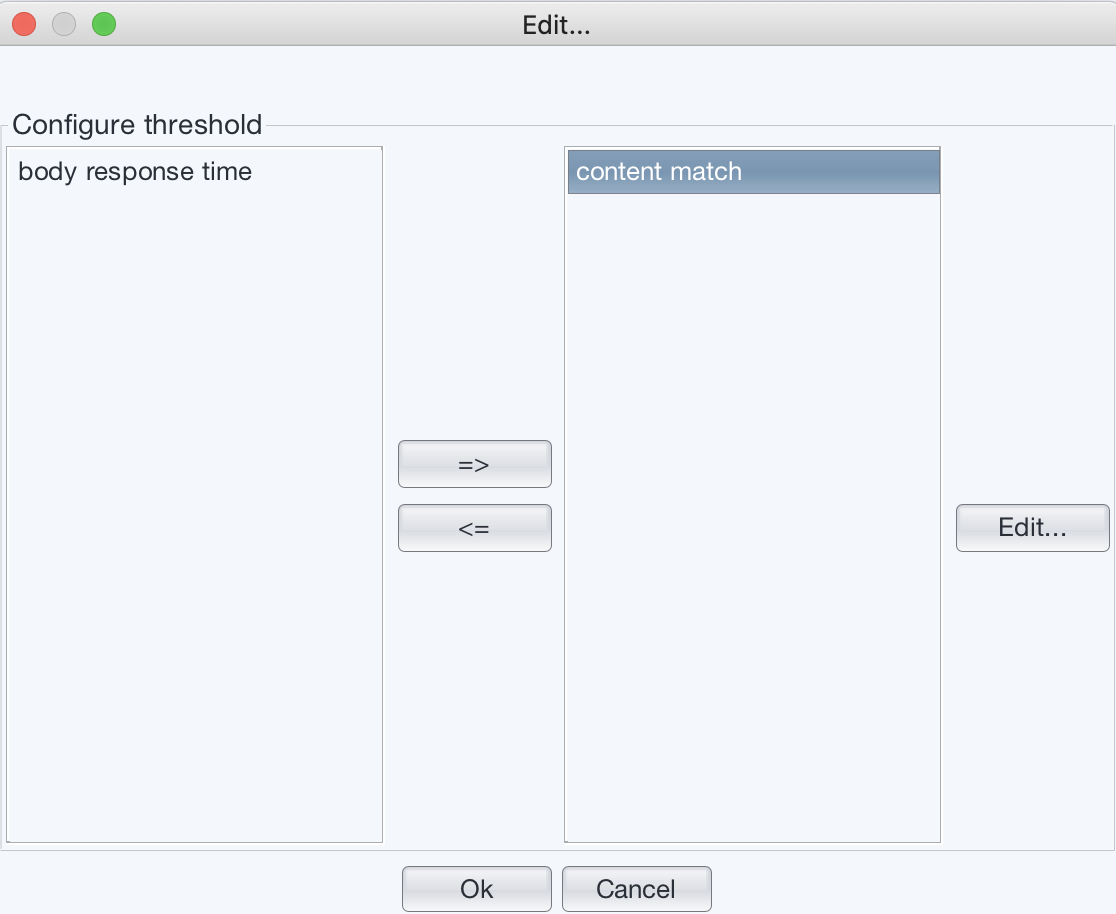
Move “body response time” to the left and move “content match” to the right panel.
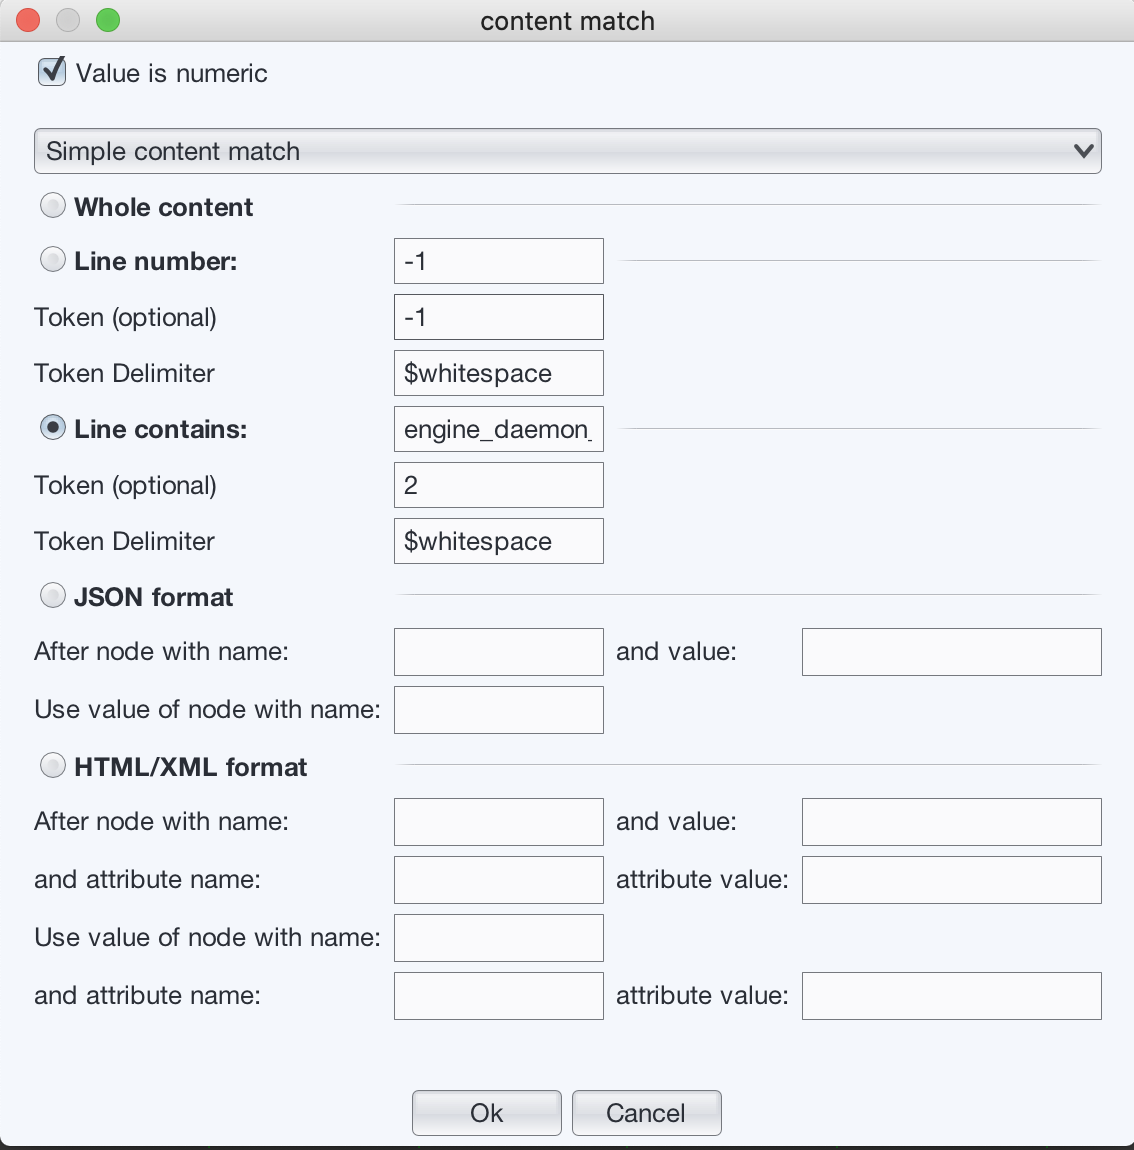
- Configure it to use simple content match, and choose
“Line contains” radio button, enter
engine_daemon_container_states_containers{state="running"}to the text field of “Line contains”. In the token field, enter “2”. The value is the second token of the line.
-
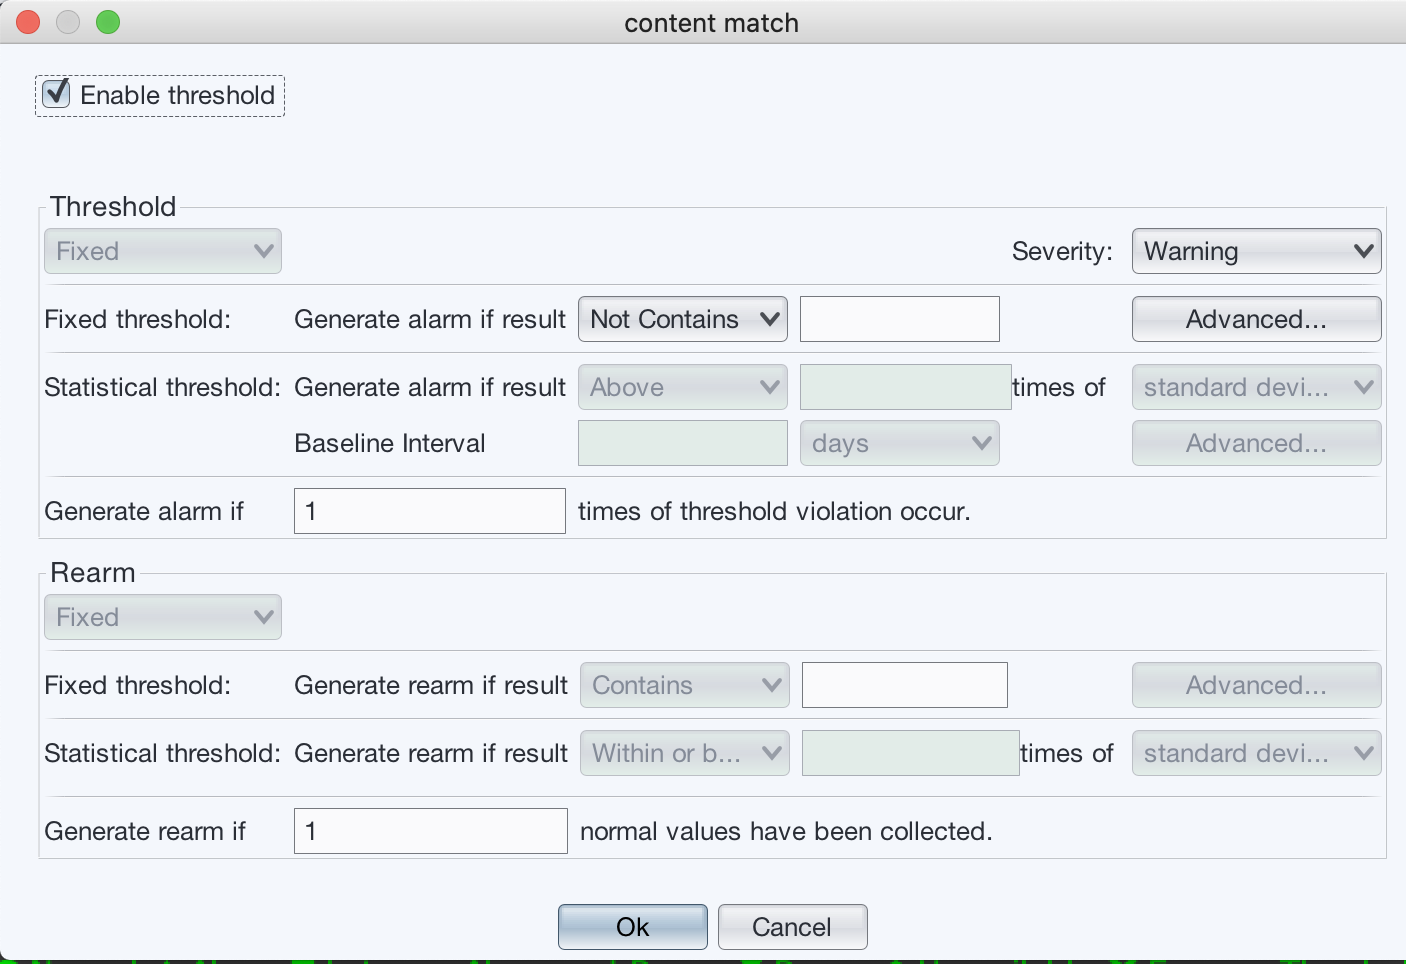
We don’t need to check threshold, so uncheck “Enable threshold” on the top.
-
Press “Ok” buttons to save the monitor.
- (Optional) In the “Manage Monitor” dialog, select the newly created monitor and press “Chart” button to see the real time chart.
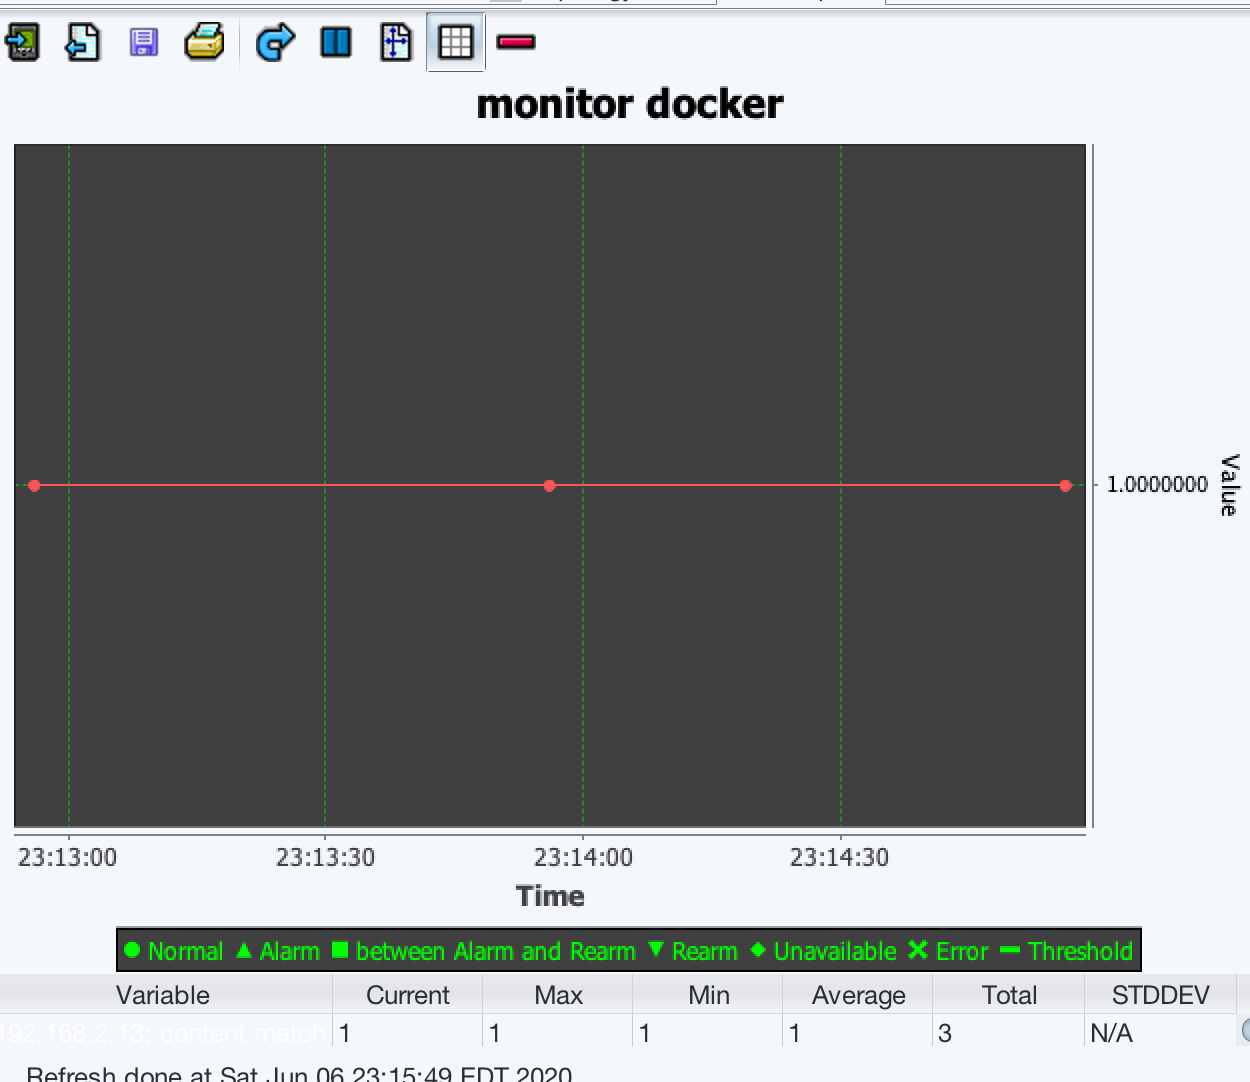
Now we have created a monitor to check docker parameter:
engine_daemon_container_states_containers{state="running"}
Then we can create similar monitors for other parameters such as
engine_daemon_container_states_containers{state="paused"}
engine_daemon_container_states_containers{state="stopped"}
engine_daemon_health_checks_failed_total
swarm_node_manager